VOL. 8, NO. 10, OCTOBER 2024 2504104
Fig. 4. Front view of the USB fan (left) and back view of the USB fan
(right).
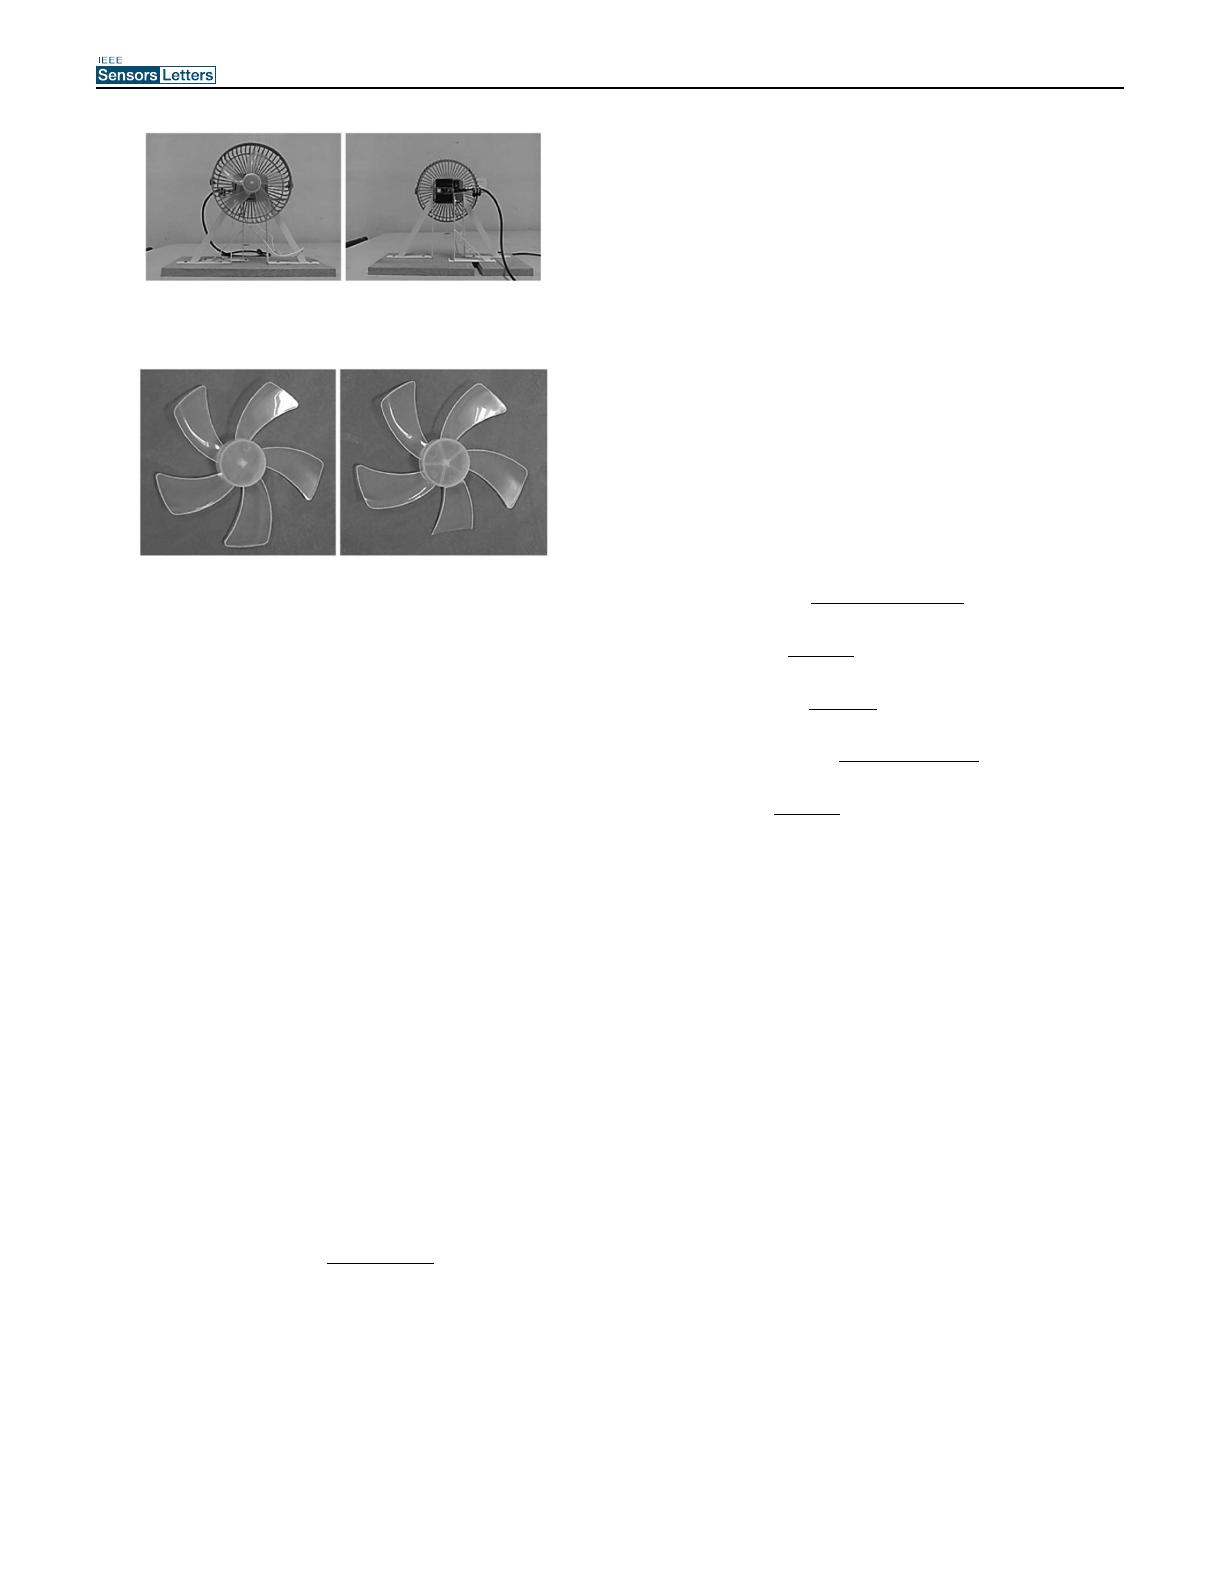
Fig. 5. Normal condition of the fan blade (left) and abnormal condition
of the fan blade (right).
of fan blades. On the left-hand side is the normal condition of the fan
blade while on the right-hand side is the abnormal condition of the
fan blade. A total of 30 000 normal datasets (15 000 for speed 1 and
15 000 for speed 2) have been collected. Only 3000 sample datasets
(1500 for speed 1 and 1500 for speed 2) have been collected for the
abnormal conditions. The raw input data were collected via the onboard
accelerometer and gyroscope of the microcontroller, Arduino Nano 33
BLE Sense. The sampling time of the accelerometer and gyroscope is
16 ms, whereas the inference time is set at 100 ms.
The proposed model MOA was developed using Python language,
TensorFlow, and Tensorflow Lite. The model was trained with unsuper-
vised machine learning; only normal datasets were used in the training,
and the validation consisted of a mixture of normal and abnormal
datasets. Train and test split is based on 80% and 20%.
In total, 80% of normal data will be used for training, and the
remaining 20% will consist of a mixture of normal and abnormal
datasets for testing. The collection of normal and abnormal datasets
was conducted in a controlled environment free from interference,
to ensure a clean dataset. The threshold value is calculated based on
the mean and standard deviation of the training loss. After training
the model, the model is uploaded into the microcontroller to make
inferences.
First, the microcontroller will read the accelerometer and gyroscope
sensor data and preprocess using min–max normalization. Then, the
model will calculate the MAE between the reconstruction output and
the input value
MAE =
n
i = 1
|
y
i
− x
i
|
n
(1)
Equation (1) shows the formula to calculate the MAE, where y
i
is
the predicted value, x
i
is the true value, and n is the total number of data
points. When the MAE value exceeds the threshold value, it indicates
an anomaly. When an anomaly is detected, a red LED will light up
substituting the normal-condition green LED.
During inferencing, the model is first uploaded to the microcon-
troller, Arduino Nano 33 BLE Sense, then tested with normal condi-
tions for both speeds and then tested for abnormal conditions for both
speeds. These steps are then repeated with another model to obtain the
comparative inferencing results.
IV. RESULTS
Several matrix evaluations have been used to evaluate the proposed
model, such as accuracy, recall, precision, F1 score, and false positive
rate (FPR). Equations (2)–(6) show the formula for calculating the
accuracy, recall, precision, F1 score, and FPR, where TP is the true
positive, TN is the true negative, FP is the false positive, and FN
is the false negative. The inference results, obtained from deploying
the model on the Arduino Nano 33 BLE microcontroller, consist of
6000 data points evenly distributed across different conditions: 1500
data points each for normal and abnormal scenarios at both speed 1
and speed 2. Accuracy is calculated based on the number of correct
predictions over the size of datasets. Besides, recall is also known as
sensitivity, which measures the number of correctly predicted positive
overall positive cases in the dataset. Precision shows the number of
positive predictions made correctly. F1 score performs better in an
imbalanced dataset [19]. FPR indicates the rate of normal instances
that were detected as anomalies. The standard AE achieved a TP of
2960, FP of 40, TN of 2977, and FN of 23. While the MOA achieved
a TP of 2963, FP of 37, TN of 2991, and FN of 9
Accuracy =
TP + TN
TP + FP + TN + FN
× 100% (2)
Recall =
TP
TP + FN
× 100% (3)
Precision =
TP
TP + FP
× 100% (4)
F1 score = 2 ×
Precision × Recall
Precision + Recall
× 100% (5)
FPR =
FP
FP + TN
× 100%. (6)
For the standard AE, the threshold was selected as 0.107515 and
achieved an accuracy of 98.95%, recall of 99.23%, precision of
98.67%, F1 score of 98.95%, and FPR of 1.326%. The threshold of our
proposed model MOA is 0.107627 and has achieved an accuracy of
99.23%, recall of 99.70%, precision of 98.77%, F1 score of 99.23%,
and FPR of 1.222%.
V. DISCUSSION
Our approach employs unsupervised machine learning with training
conducted on an imbalanced dataset. Our proposed MOA model
outperforms the existing AE architecture as indicated in [12],where
the AE model achieved 92% accuracy, 90% precision, and 99% recall
using the AE model. By introducing additional input, such as the
gyroscope data, our proposed model MOA achieved an accuracy of
99.23%, recall of 99.70%, precision of 98.77%, F1 score of 99.23%,
and FPR of 1.222%. We also achieved an accuracy of 98.95%, recall
of 99.23%, precision of 98.67%, F1 score of 98.95%, and FPR of
1.326% with the standard AE. While the improvements in our MOA
model compared to the standard AE are modest, our analysis concludes
that MOA exhibits superior performance across all metrics, including
higher accuracy, higher recall, higher precision, higher F1 score, and
lower FPR. A lower FPR indicates improved accuracy and reduced
errors.
Our article demonstrated that despite the difference in sampling
time (16 ms sampling time of accelerometer and gyroscope) and the
inferencing time (100 ms), the model can still perform effectively. The
MOA AE size is 17 kB, larger than the standard AE model of 13 kB,
which contributes to improved metric scores.
Authorized licensed use limited to: MCKV Institute of Engineering. Downloaded on April 15,2026 at 05:55:48 UTC from IEEE Xplore. Restrictions apply.


