© Houghton Mifflin Harcourt Publishing Company
Explore 2
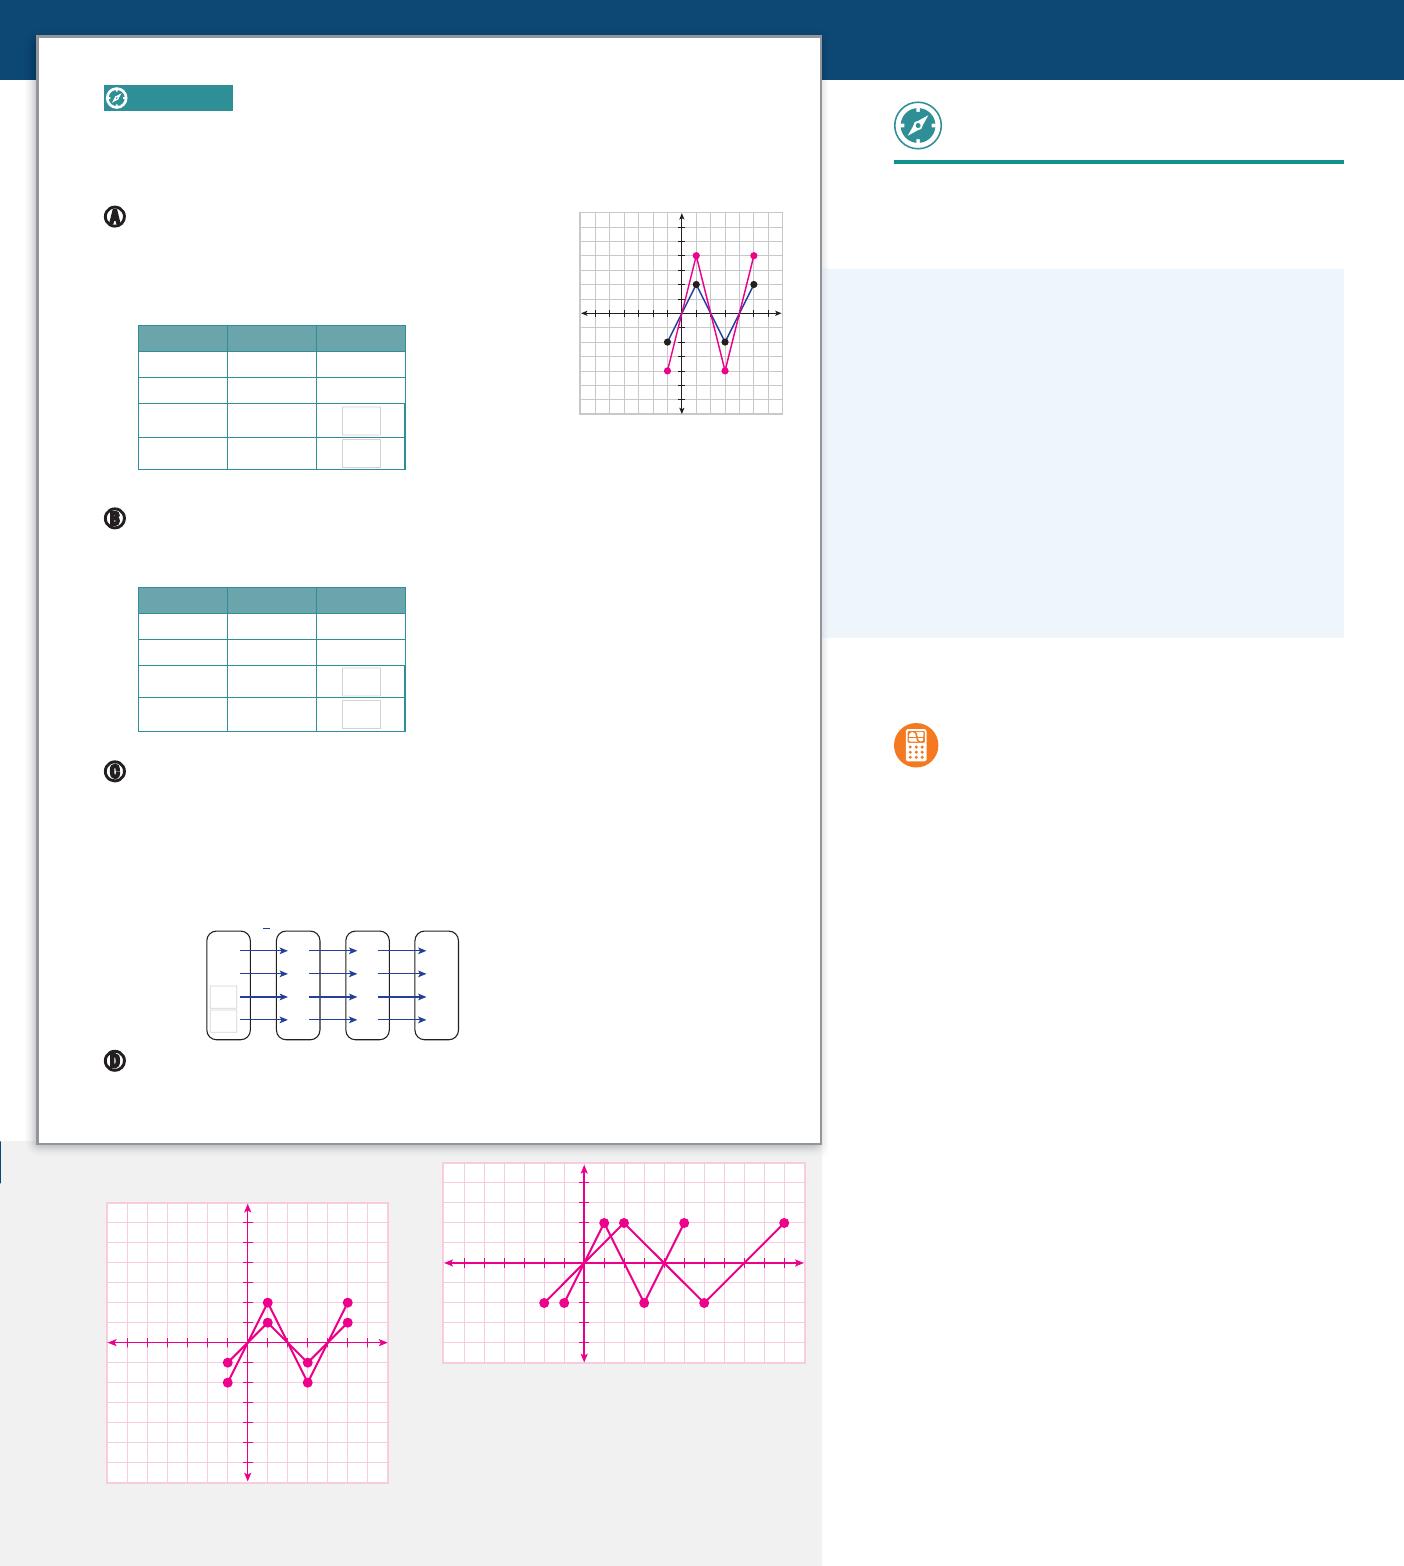
Investigating Stretches and Compressions
of Function Graphs
In this activity, you will consider what happens when you multiply by a positive parameter inside or outside a
function. Throughout, you will use the same function ƒ
(
x
)
that you used in the previous activity.
First graph g
(
x
)
= a ⋅ ƒ
(
x
)
where a is the parameter. Let a = 2
so that g
(
x
)
= 2ƒ
(
x
)
. Complete the input-output table and then
graph g
(
x
)
with f(x). In general, how is the graph of
g
(
x
)
= a ⋅ ƒ
(
x
)
related to the graph of ƒ
(
x
)
when a is greater
than 1?
xf(x) 2f(x)
-1 -2 -4
124
3 -2
52
Now try a value of a between 0 and 1 in g
(
x
)
= a ⋅ ƒ
(
x
)
. Let a =
1
_
2
so that g
(
x
)
=
1
_
2
ƒ
(
x
)
.
Complete the input-output table and then graph g
(
x
)
with f(x). In general, how is the graph
of g
(
x
)
= a ⋅ ƒ
(
x
)
related to the graph of ƒ
(
x
)
when a is a number between 0 and 1?
xf(x)
1
__
2
f(x)
-1 -2 -1
121
3 -2
52
Now graph g
(
x
)
= ƒ
(
1
__
b
⋅ x
)
where b is the parameter. Let b = 2 so that g
(
x
)
= ƒ
(
1
__
2
x
)
.
Complete the mapping diagram and then graph g
(
x
)
with f(x). (To complete the mapping
diagram, you need to find the inputs for g that produce the inputs for f after you multiply
by
1
_
2
. Work backward from the inputs for f to the missing inputs for gby multiplying by 2.)
In general, how is the graph of g
(
x
)
= ƒ
(
1
__
b
x
)
related to the graph of ƒ
(
x
)
when b is a number
greater than 1?
Make a Conjecture How would you expect the graph of g
(
x
)
= ƒ
(
1
__
b
⋅ x
)
to be related
to the graph of ƒ
(
x
)
when b is a number between 0 and 1?
?
?
?
?
6
10
Input
for g
Input
for f
Output
for f
Output
for g
-
2
2
-
1
1
3
5
-
2
2
-
2
2
-
2
2
-
2
2
·
1
2
?
?
-
4
-
6
4
6
2
0
462
x
-
2
-
4
-
6
-4
4
For a > 1, the graph of g(x) = a ⋅ f(x) is the
graph of f(x) stretched vertically (away
from the x-axis) by a factor of a.
See graph in margin.
See graph in margin.
See margin.
-1
1
For 0 < a < 1, the graph of g(x) = a ⋅ f(x) is
the graph of f(x) compressed vertically
(toward the x-axis) by a factor of a.
For b > 1, the graph of g(x) = f
(
1
__
b
⋅ x
)
is
the graph of f(x) stretched horizontally
(away from the y-axis) by a factor of b.
Module 1
25
Lesson 3
Explore 2
Investigating Stretches and
Compressions of Function Graphs
Questioning Strategies
On the coordinate plane, what is the difference
between a vertical stretch and a vertical
compression? In a vertical stretch, the points of the
graph are pulled away from the x-axis. In a vertical
compression, they are pulled toward the x-axis.
On the coordinate plane, what is the difference
between a horizontal stretch and a vertical
stretch? In a horizontal stretch, the points of the
graph are pulled away from the y-axis. In a vertical
stretch, the points of the graph are pulled away
from the x-axis.
Integrate Technology
A graphing calculator can be used to explore
the effects of different values of b in the
function g
(
x
)
= f
(
1
_
b
x
)
on the graph of f
(
x
)
. Choose a
simple function for f
(
x
)
, graph the function, and have
students suggest different values for b. Graph the
transformed functions, and have students compare
the graphs to see how changing the parameter affects
the graph.
Integrate Math Processes and Practices
Focus on Abstract and Quantitative
Reasoning
MPP2 Prompt students to recognize that when the
graph of a function passes through the origin, a
transformation involving a stretch or a compression of
the function will not affect the point at the origin. Ask
students to justify how this is possible, when all points
on either side of the origin are affected.
Answers
-
4
-
6
4
6
2
y
0
462
x
-
2
-
4
-
6
B.
-
4
4
2
y
0
468102
x
-
2
-
4
-
6
C.
D. For 0 < b < 1, the graph of g(x) = f
(
1
__
b
⋅ x
)
is the graph of f(x) compressed horizontally
(toward the y-axis) by a factor of b.
Lesson 1.3 25


