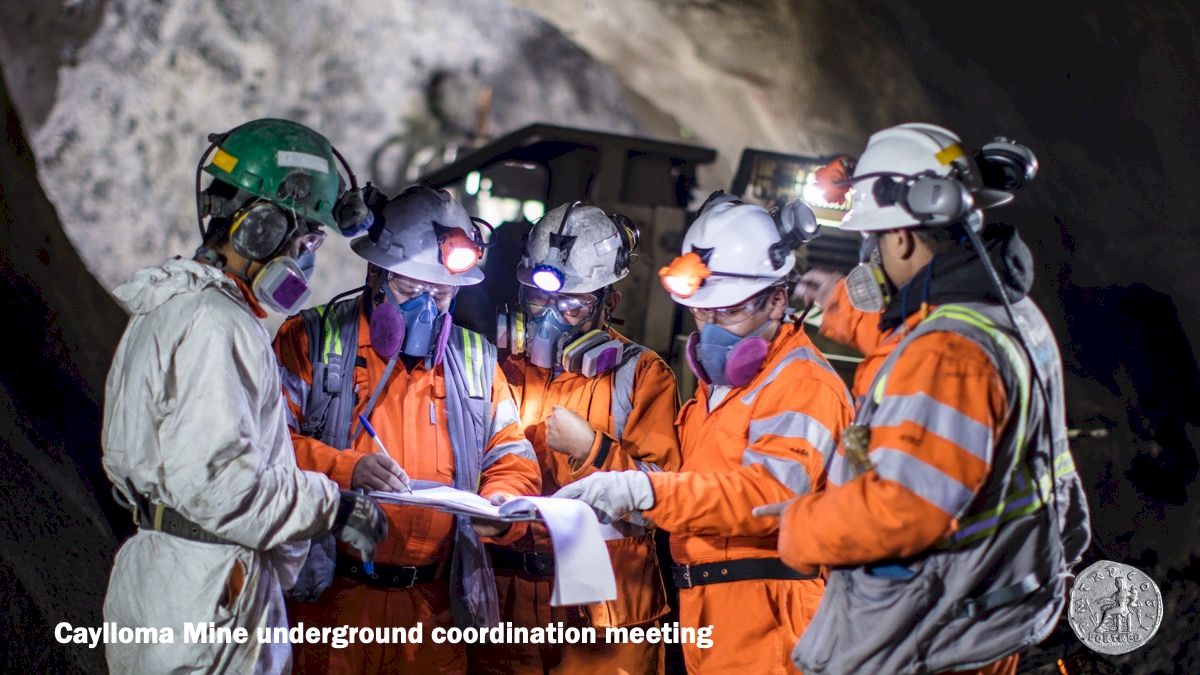
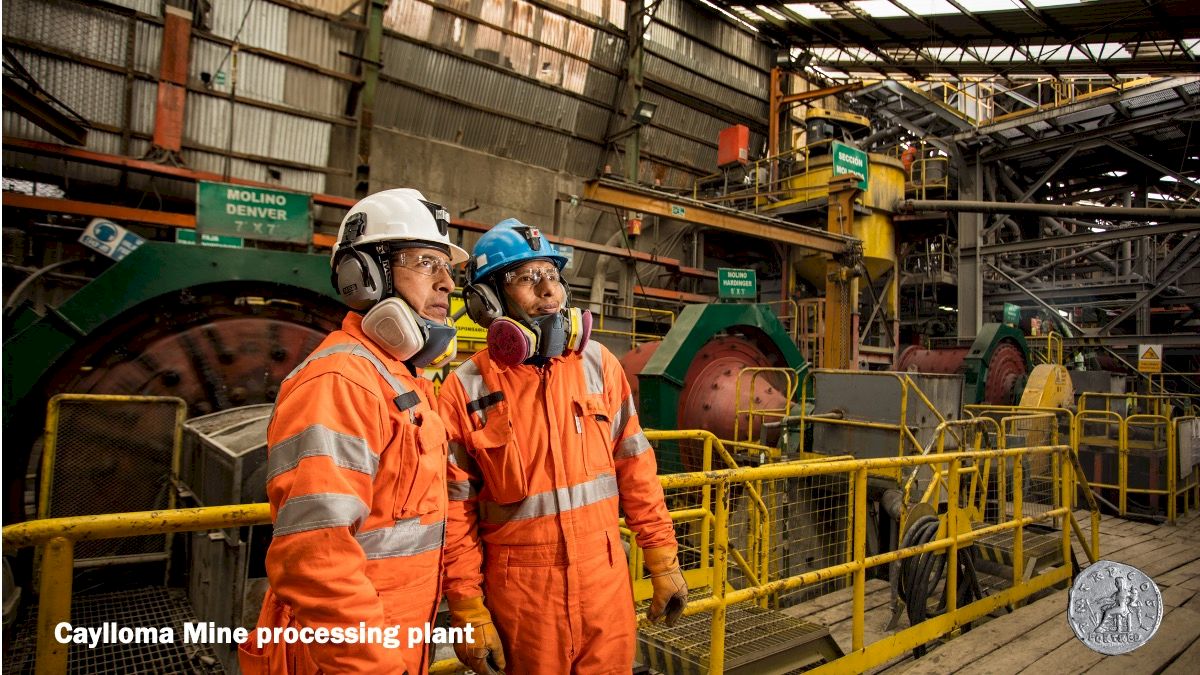
Our Caylloma Mine in the Caylloma District of Arequipa, Peru, produces silver, gold, zinc, and lead. The underground mine is operated by Compania Minera Bateas S.A.C. (Bateas), a Peruvian subsidiary 100% owned by Fortuna. The deposit is a low to intermediate sulfidation epithermal vein system, and, based on December 31, 2023 reserves the operation has a mine life of five years.
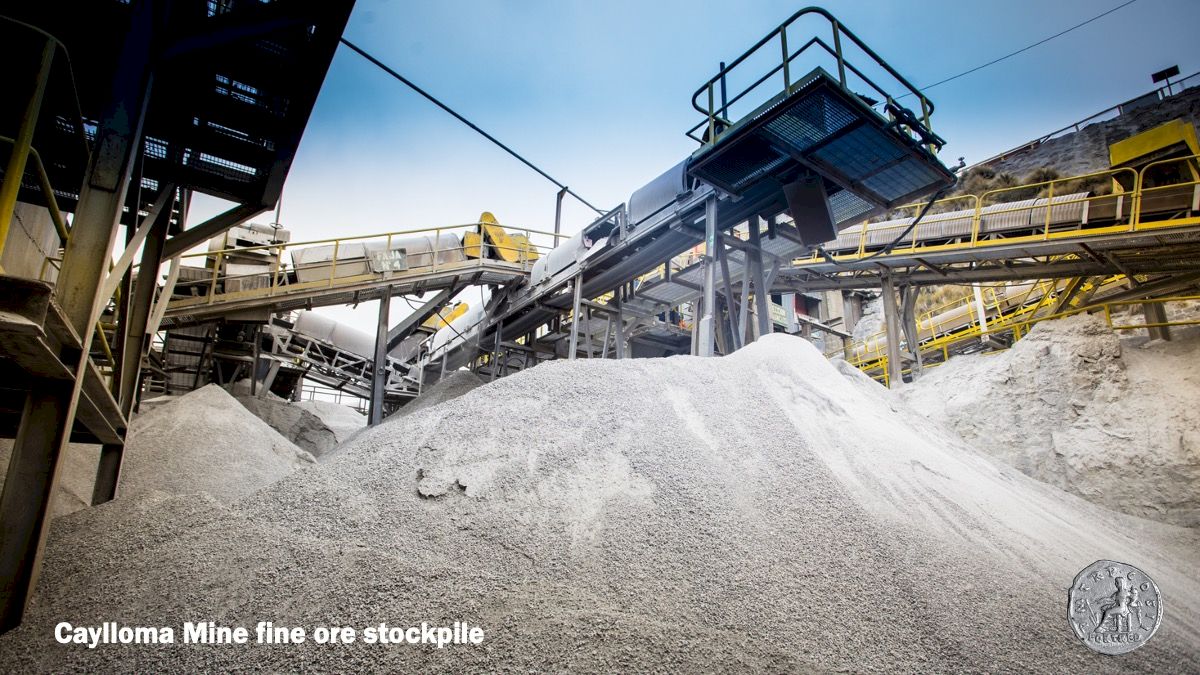
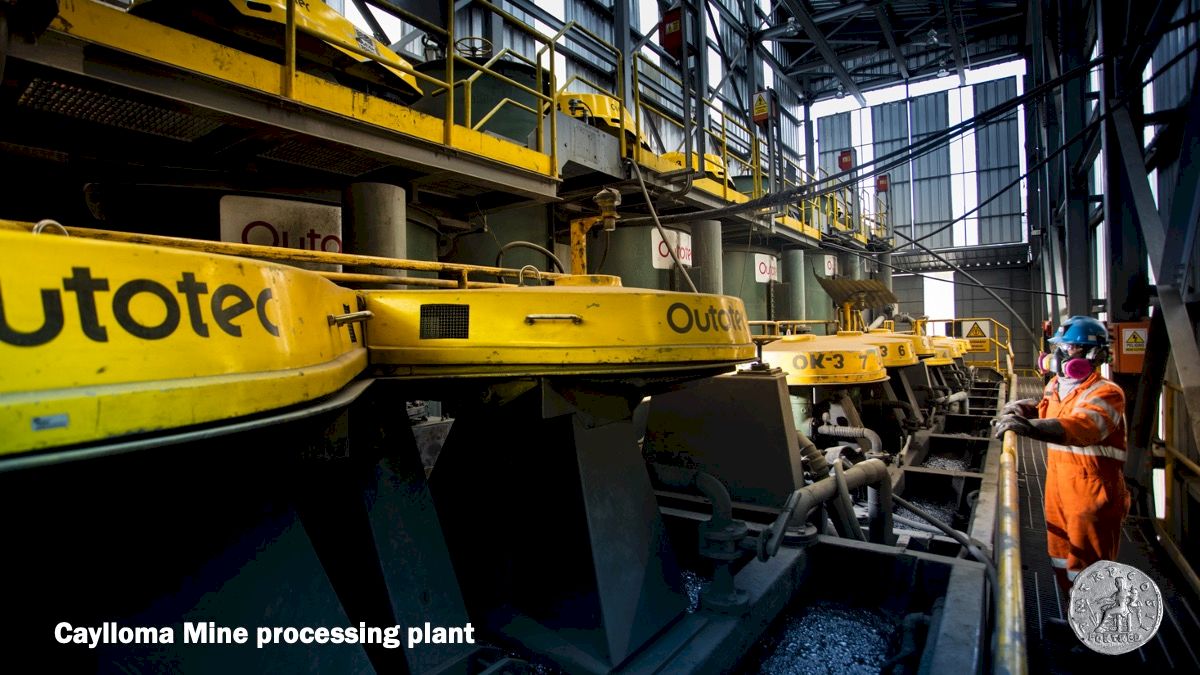
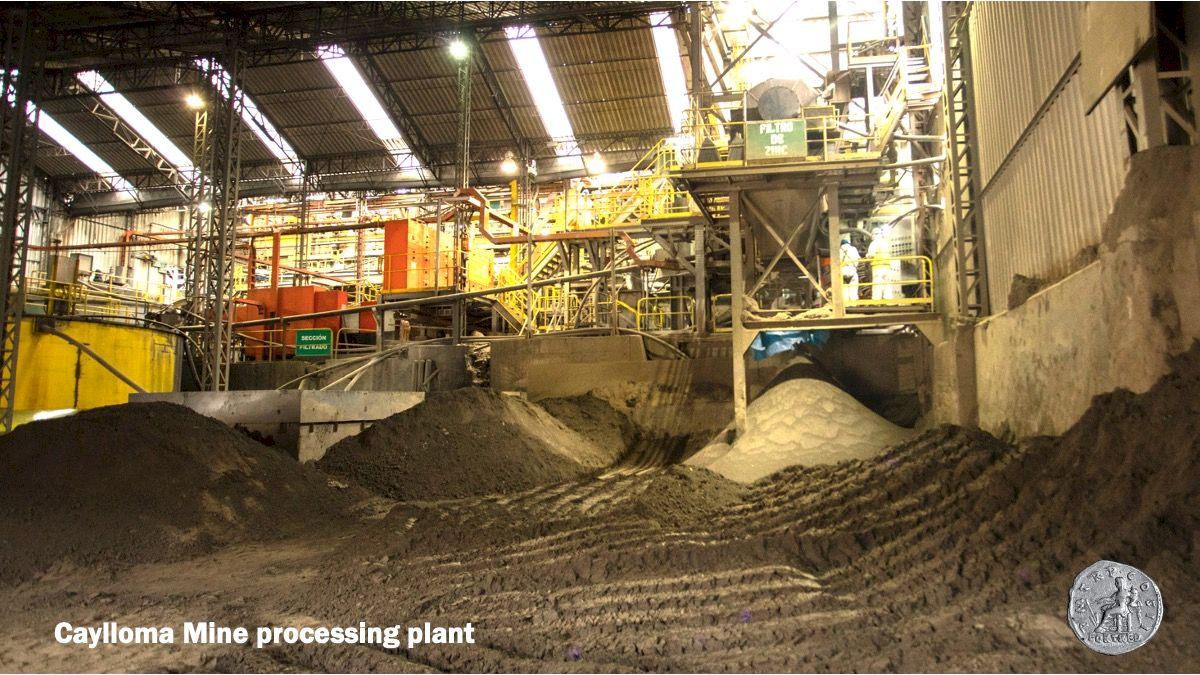
People have historically mined silver in the Caylloma District for over 500 years. Fortuna acquired the Caylloma Mine in 2005 and relaunched operations the following year after expanding and modernizing the processing plant in 2006. In 2016, the processing plant was upgraded to process 1,430 tonnes per day. In 2023, the mine produced 1.23 million ounces of silver, and record base metal production of 40.8 million pounds of lead, and 55.1 million pounds of zinc.
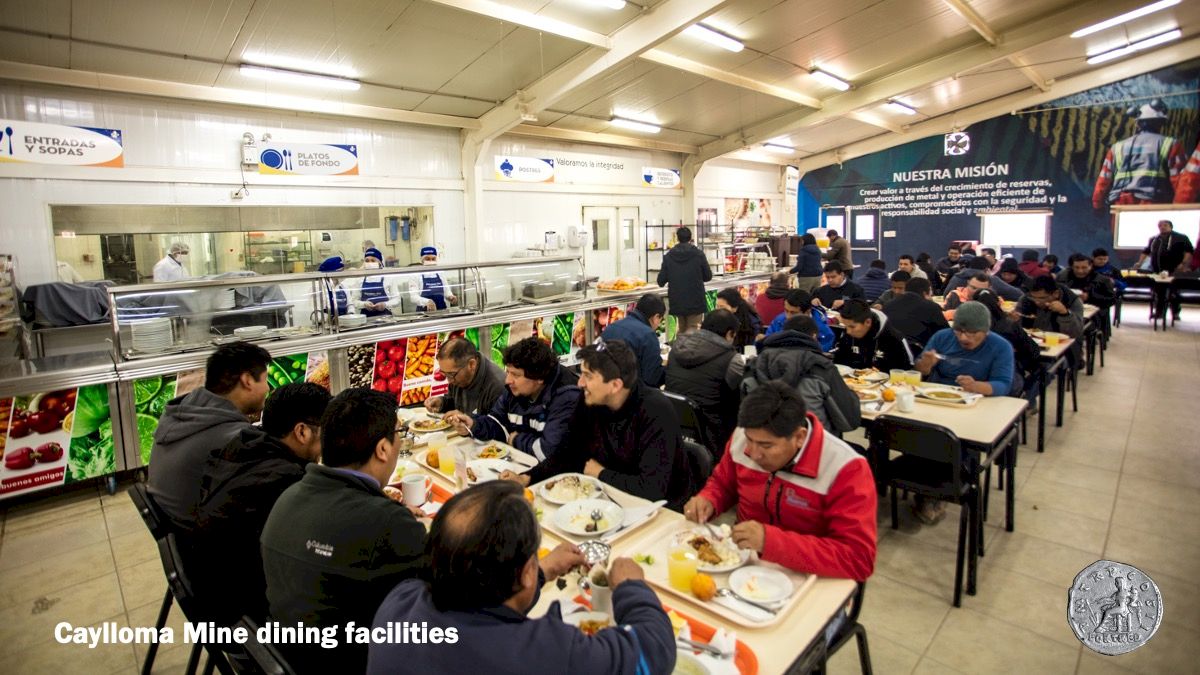
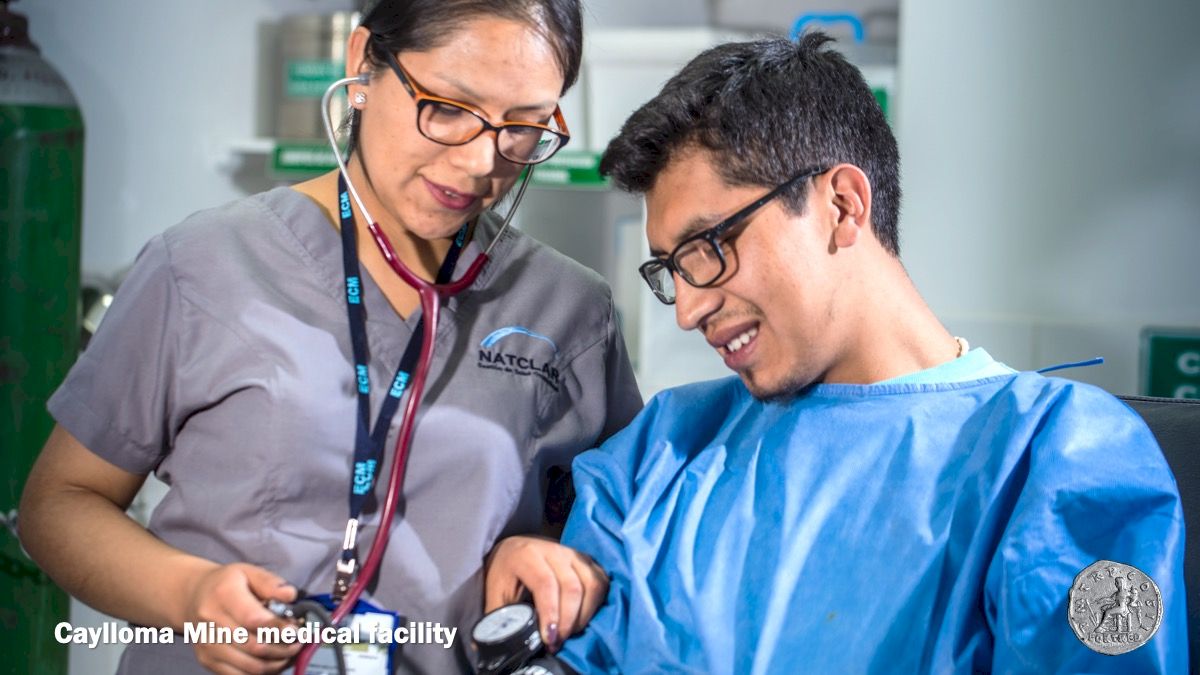
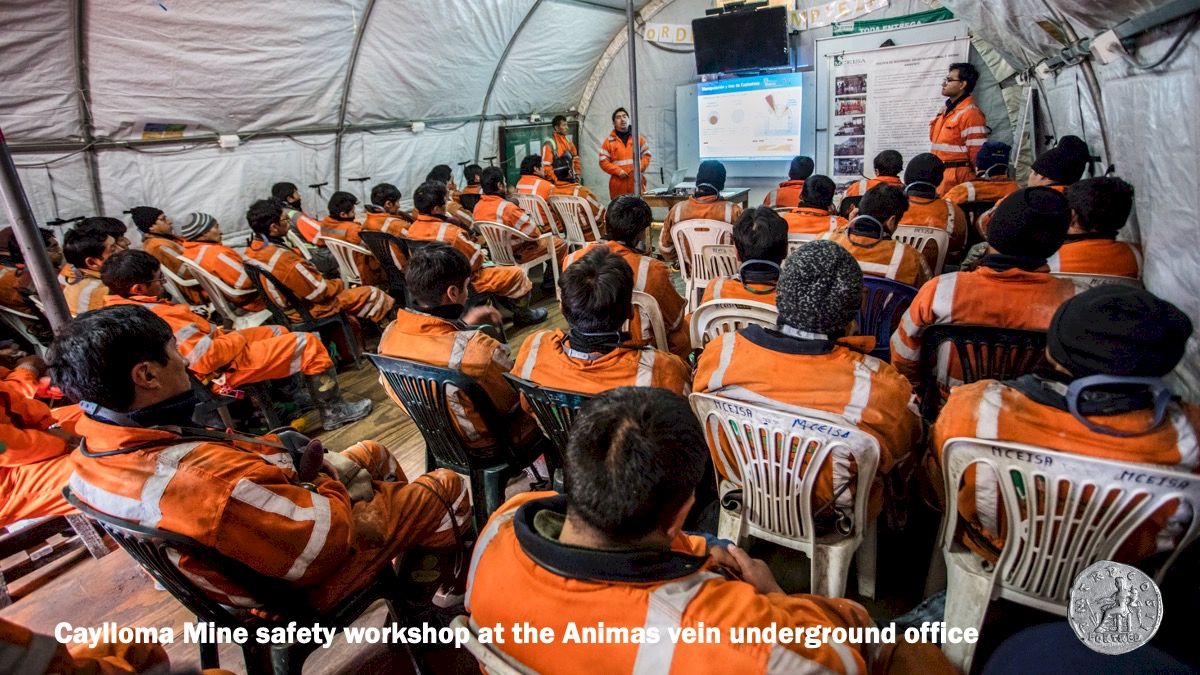
For more than 16 years, our Caylloma Mine has provided jobs and economic benefits to support sustainable development in the district of Caylloma. In 2023, we employed 1,086 direct employees and contractors. We also partnered with 40 local suppliers. To learn more about ESG performance at Minera Bateas, please click here (Spanish).
Caylloma Mine Video
Share

Commodities
Silver, zinc, lead

Ownership
100%
Operation
543,876
tonnes milled in 2023
Claim block area
36,000
hectares

Deposit type
Intermediate sulphidation
epithermal deposit
epithermal deposit

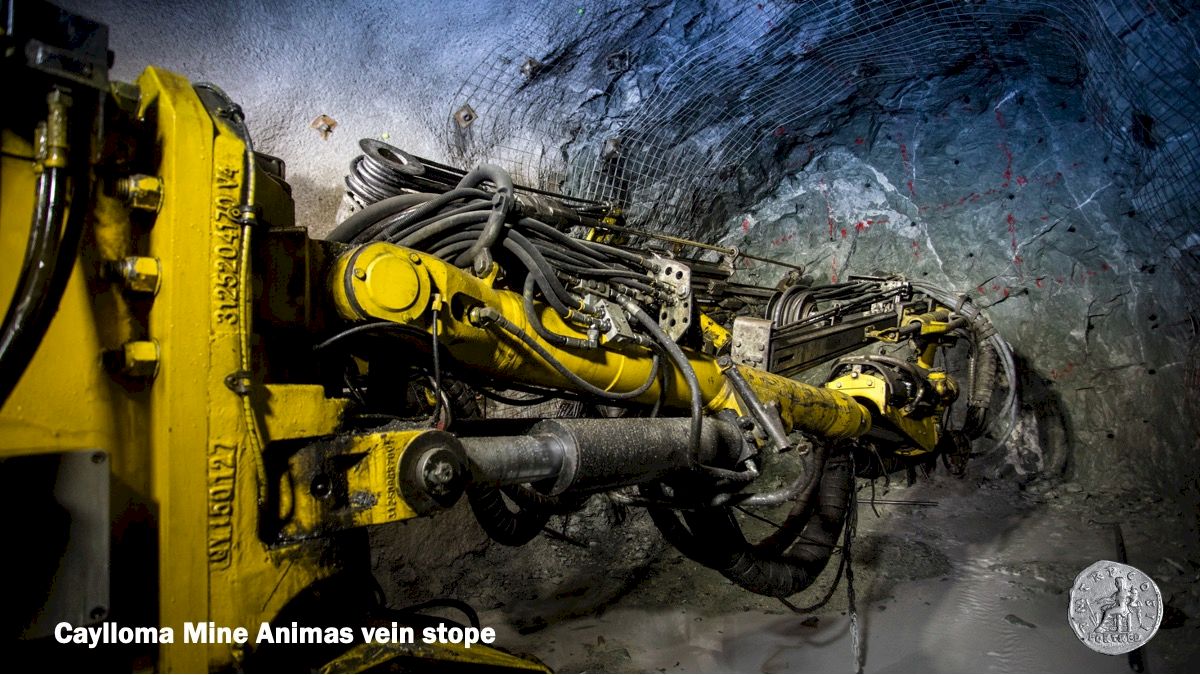
Mining method
Underground
cut-and-fill
cut-and-fill
OPERATING HIGHLIGHTS
|
20231 |
2024E1 |
|
|---|---|---|
|
Tonnes milled (000) |
544 |
500 |
|
Average milled (tpd) |
1,528 |
1,370 |
|
Silver production (Moz) |
1.2 |
0.9 - 1.1 |
|
Gold production (koz) |
- |
- |
|
Lead production (Mlbs) |
40.8 |
29 - 34 |
|
Zinc production (Mlbs) |
55.1 |
36 - 39 |
|
AISC2,3,4 (US$/oz AgEq) |
$19.90 |
$18.0 - $21.0 |
Notes:
- Refer to Fortuna news releases dated January 18, 2023, "Fortuna reports record 2023 production of 452 koz Au Eq and 2024 annual guidance of 457 to 497 koz Au Eq"
- Cash Cost and all-in sustaining cost (AISC) are non-IFRS financial measures which are not standardized financial measures under the financial reporting framework used to prepare the financial statements of the Company and might not be comparable to similar financial measures disclosed by other issuers. Refer to the note under “Non-IFRS Financial Measures” on this website.
- The following table provides the historical cash costs and historical AISC for the four operating mines for the year ended December 31, 2022, as follows:
Mine Cash Costa,b,c AISCa,b,c SILVER ($/oz AgEq) ($/oz AgEq) San Jose, Mexico 10.56 15.11 Caylloma, Peru 12.34 17.97 GOLD ($/oz Au) ($/oz Au) Lindero, Argentina 740 1,142 Yaramoko, Burkina Faso 840 1,529 - (a) Cash cost and AISC are non-IFRS financial measures; refer to the note under “Non-IFRS Financial Measures” on this website.
- (b) Silver equivalent was calculated at metal prices of $1,802/oz Au, $21.75/oz Ag, $2,161/t Pb and $3,468/t Zn for the year ended December 31, 2022
- (c) Further details on the cash costs and AISC for the year ended December 31, 2022 are disclosed on pages 38, 40, and 41 (with respect to cash costs) and pages 39 and 42 (with respect to AISC) of the Company’s management discussion and analysis (“MD&A”) for the year ended December 31, 2022 dated as of March 15, 2023 (“2022 MD&A”) which is available under Fortuna's SEDAR+ profile at www.sedarplus.ca and is incorporated by reference into this news release, and the note under “Non-IFRS Financial Measures” on this website.
- Cash cost includes production cash cost. AISC includes sustaining capital expenditures, worker’s participation (as applicable) commercial and government royalties mining tax, export duties (as applicable), subsidiary G&A and Brownfields exploration and is estimated at metal prices of $1,800/oz Au, $22/oz Ag, $2,000/t Pb, and $2,500/t Zn. AISC excludes government mining royalty recognized as income tax within the scope of IAS-12.
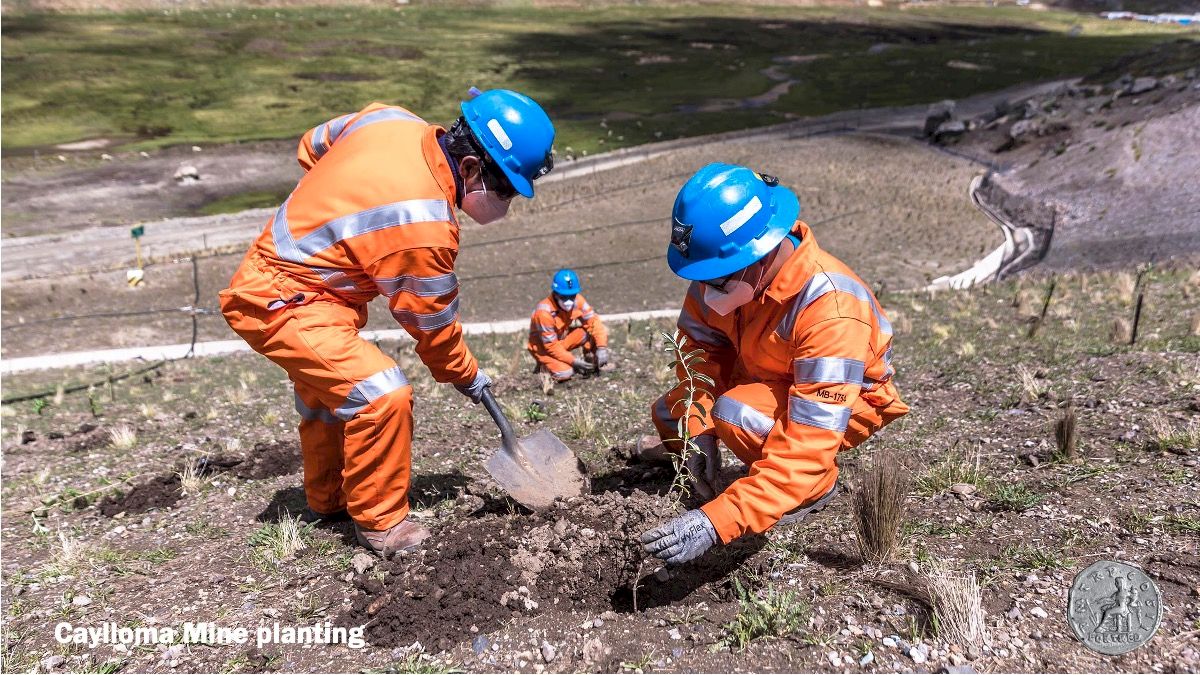
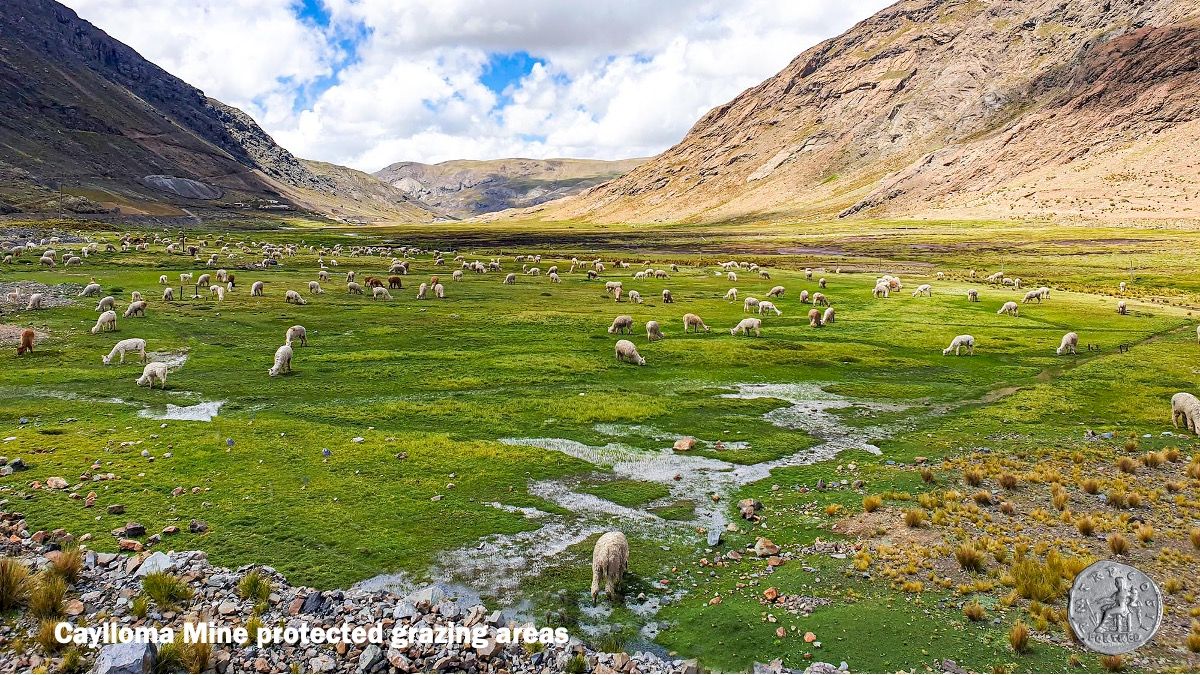
PARTNERS IN SUSTAINABLE DEVELOPMENT
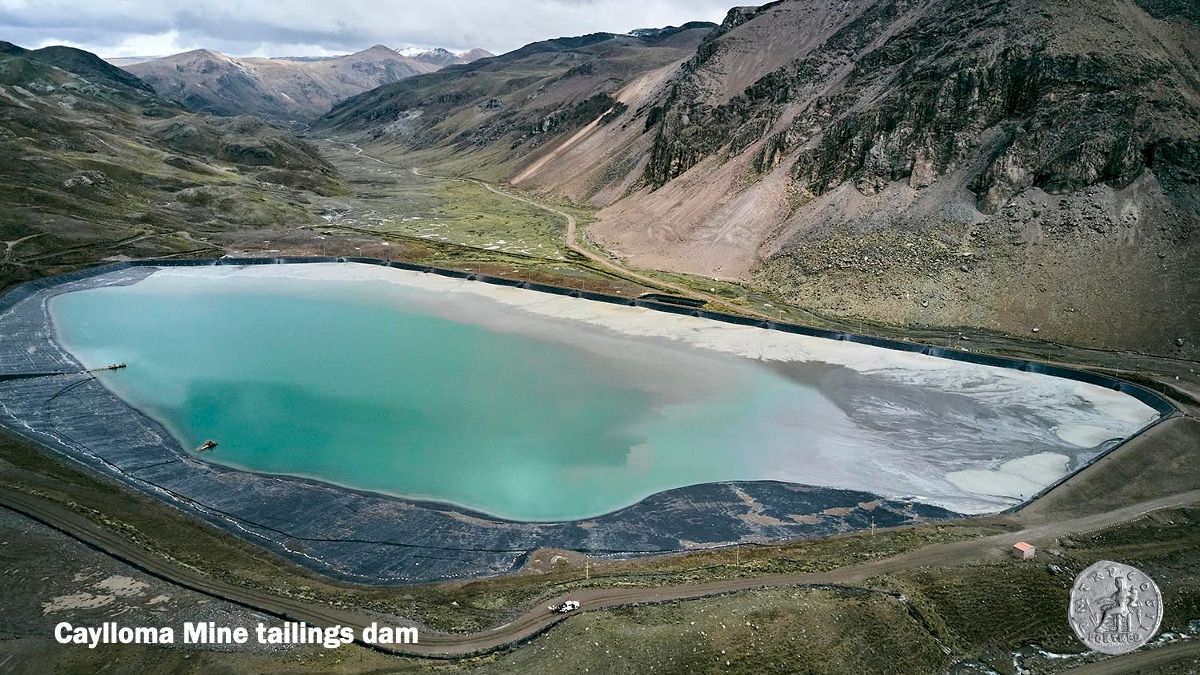
CLEAN WATER AND SANITATION
- Water monitoring
- Tailings management
- Pollution reduction
DECENT WORK AND ECONOMIC GROWTH
- Local employees
- Local suppliers
- Supporting entrepreneurs
CLIMATE ACTION
- Optimize energy consumption
- ISO 45001 certification
- Reduce GHG emissions
RESPONSIBLE CONSUMPTION AND PRODUCTION
- Hazardous material management
- Reduce and recycle
- Closure plan
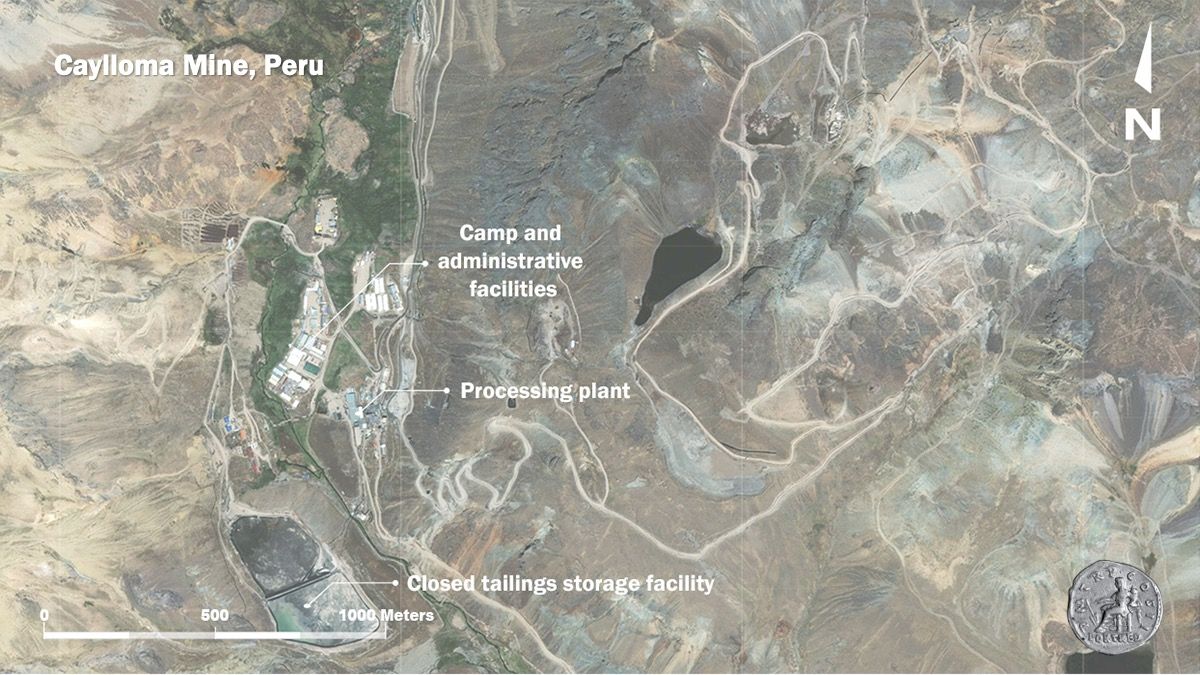
LOCATION
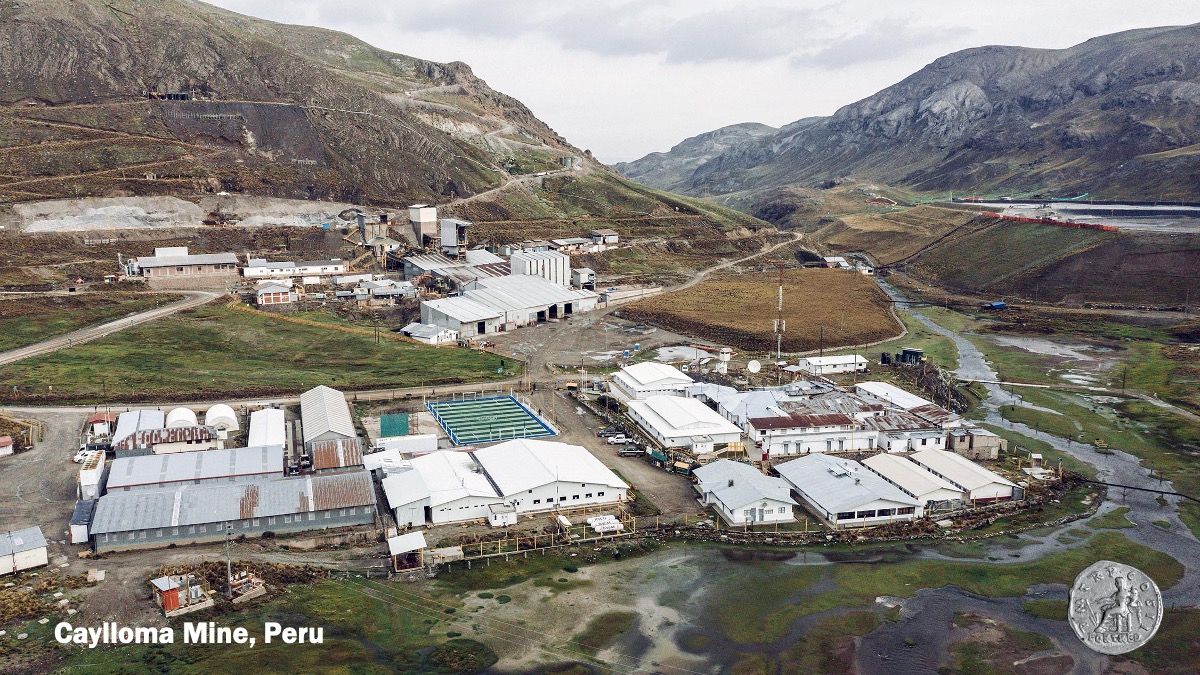
Our Caylloma mine is located in the Caylloma mining district, approximately 225 kilometers northwest of Arequipa, Peru (Latitude: 15° 12’ 15” S, Longitude: 71° 51’ 40” W). The site is 4,500 meters above sea level and includes the mine, a processing plant, and related infrastructure. The mine is connected to the national power grid, and mining occurs year-round.
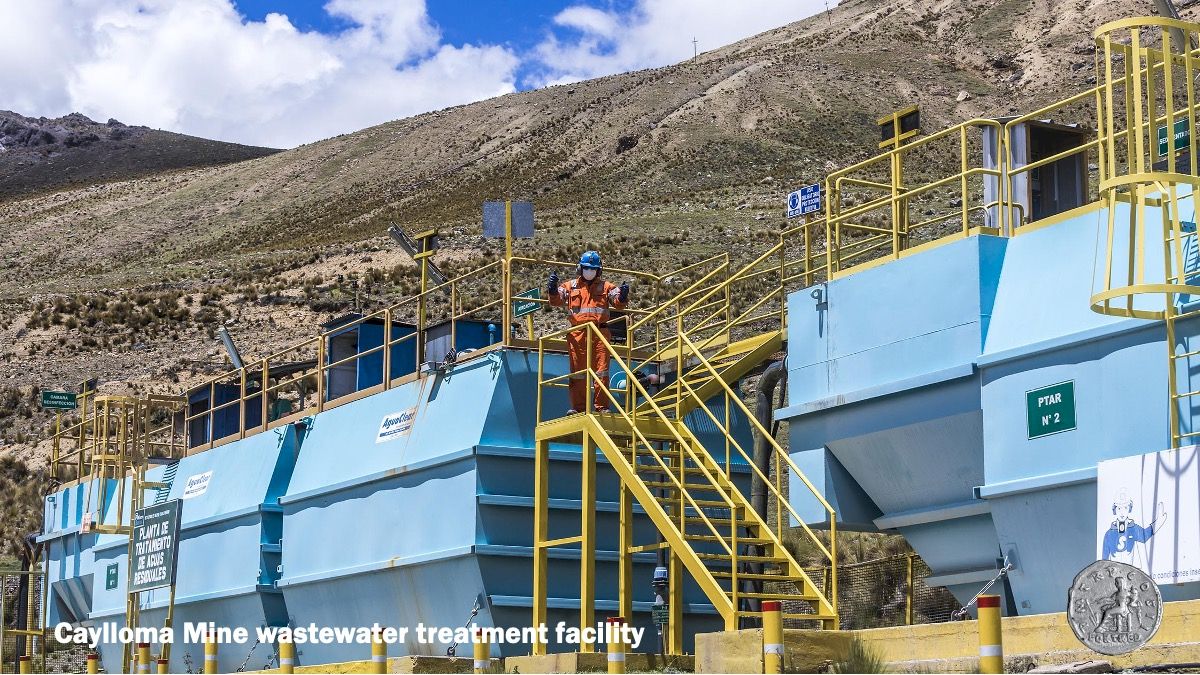
At Caylloma, our freshwater source is the Santiago River. We focus on minimizing water collection and maximizing water reuse and include the local authorities and community members in participatory monitoring multiple times per year.
The mine is located 14 kilometers northwest of the town of Caylloma, our nearest neighbor. Our relationship with the residents and local government in Caylloma is built on dialogue, engagement and transparency.

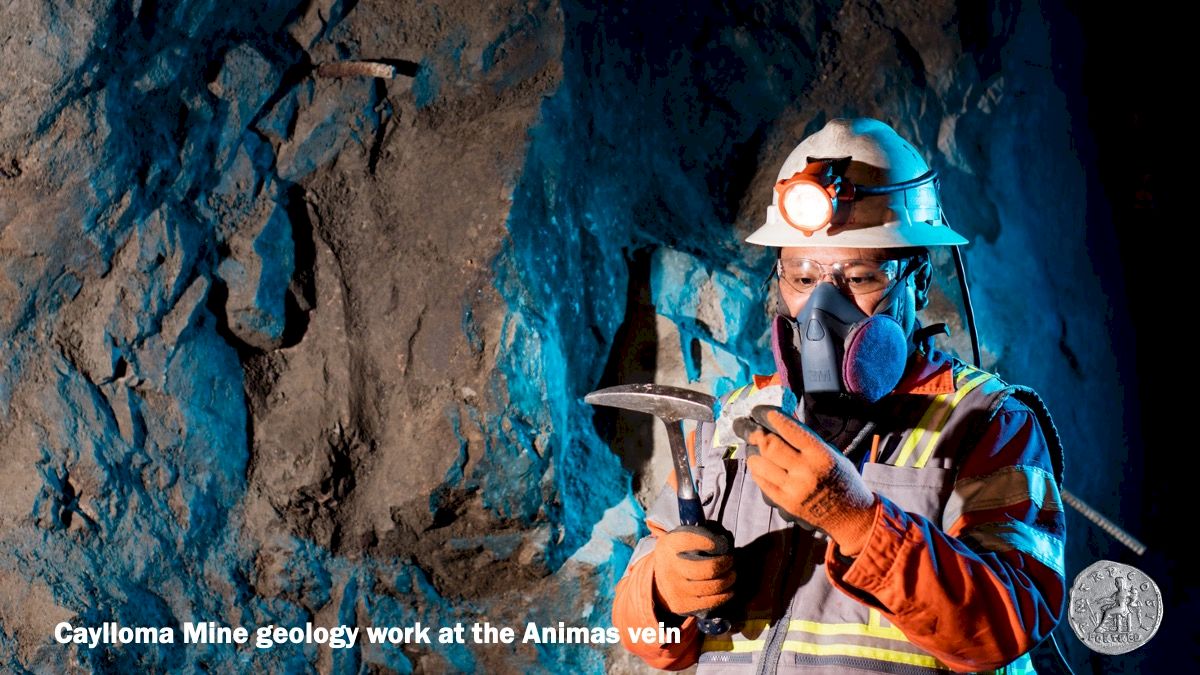
GEOLOGY AND MINERALIZATION
More than 15 major silver and base metal-rich epithermal vein sets have been identified within the Caylloma district. The veins are hosted by Tertiary calc-alkaline andesitic volcanic sequences that unconformably overlie folded marine sediments. The veins are one to 25 meters wide, up to four kilometres long, typically trending north-easterly and dipping moderately to steeply to the southeast or northwest.
MINERAL RESERVES
2.3 million tonnes
averaging 83 g/t Ag, 2.78% Pb, and 4.04% Zn
Refer to Mineral Reserves and Resources table below for full disclosure
BROWNFIELDS EXPLORATION
The Brownfields exploration program budget for 2024 at Caylloma is $2.0 million, supporting field exploration, regional geophysics, and ongoing studies of the structural controls to mineralization on the Animas vein.
Mineral Reserves and Resources
|
Mineral Reserves - Proven and Probable |
Contained Metal |
|||||||
|---|---|---|---|---|---|---|---|---|
|
Property |
Classification |
Tonnes (000) |
Ag (g/t) |
Au (g/t) |
Pb (%) |
Zn (%) |
Ag (Moz) |
Au (koz) |
|
Caylloma, Peru |
||||||||
|
Silver Veins |
Proven |
7 |
583 | 2.20 | 0.77 | 0.94 | 0.1 | 0.5 |
|
Probable |
48 | 447 | 1.40 | 0.72 | 0.82 | 0.7 | 2.2 | |
|
Proven + Probable |
56 | 465 | 1.51 | 0.72 | 0.83 | 0.8 | 2.7 | |
|
Polymetallic Veins |
Proven |
12 |
74 | 0.20 | 3.09 | 3.59 | 0.0 | 0.1 |
|
Probable |
2,220 | 73 | 0.10 | 2.83 | 4.13 | 5.2 | 7.1 | |
|
Proven + Probable |
2,233 | 73 | 0.10 | 2.83 | 4.12 | 5.3 | 7.2 | |
|
Combined-All Veins |
Proven |
20 |
261 | 0.94 | 2.23 | 2.62 | 0.2 | 0.6 |
|
Probable |
2,269 |
81 | 0.13 | 2.79 | 4.06 | 5.9 | 9.3 | |
|
Proven + Probable |
2,288 |
83 |
0.13 |
2.78 |
4.04 |
6.1 |
9.9 |
|
|
Mineral Resources - Measured and Indicated |
Contained Metal |
|||||||
|---|---|---|---|---|---|---|---|---|
|
Property |
Classification |
Tonnes (000) |
Ag (g/t) |
Au (g/t) |
Pb (%) |
Zn (%) |
Ag (Moz) |
Au (koz) |
|
Caylloma, Peru |
Measured |
524 |
98 | 0.30 | 2.09 | 3.16 | 1.6 | 5.0 |
|
Indicated |
1,262 | 82 | 0.21 | 1.47 | 2.54 | 3.3 | 8.5 | |
|
Measured + Indicated |
1,786 |
87 |
0.24 |
1.65 |
2.72 |
5.0 |
13.6 |
|
|
Mineral Resources - Inferred |
Contained Metal |
|||||||
|---|---|---|---|---|---|---|---|---|
|
Property |
Classification |
Tonnes (000) |
Ag (g/t) |
Au (g/t) |
Pb (%) |
Zn (%) |
Ag (Moz) |
Au (koz) |
|
Caylloma, Peru |
Inferred |
4,505 |
99 |
0.43 |
2.43 |
3.70 |
14.4 |
62.8 |
-
Notes:
- Mineral Reserves and Mineral Resources are as defined by the 2014 CIM Definition Standards for Mineral Resources and Mineral Reserves
- Mineral Resources are exclusive of Mineral Reserves
- Mineral Resources that are not Mineral Reserves do not have demonstrated economic viability
- Factors that could materially affect the reported Mineral Resources or Mineral Reserves include; changes in metal price and exchange rate assumptions; changes in local interpretations of mineralization; changes to assumed metallurgical recoveries, mining dilution and recovery; and assumptions as to the continued ability to access the site, retain mineral and surface rights titles, maintain environmental and other regulatory permits, and maintain the social license to operate
- Caylloma Mineral Resources and Reserves are reported as of December 31, 2023
- Mineral Reserves for the Caylloma Mine are reported above NSR breakeven cut-off values based on underground mining methods including: mechanized (breasting) that represents 91 % of Mineral Reserves planned for mining at $89.78/t, mechanized (uppers) at $79.70/t, semi-mechanized at $ 93.27/t, sub-level stoping at $88.81/t, and a conventional method at $170/t; using assumed metal prices of $21/oz Ag, $1,600/oz Au, $2,000/t Pb, and $2,600/t Zn; metallurgical recovery rates of 82 or 85 % for Ag, 22 or 55 % for Au, 87 or 89 % for Pb and 89 % for Zn. Mining, processing, and administrative costs used to determine NSR cut-off values were estimated based on actual operating costs incurred from July 2022 through June 2023. Mining recovery is estimated to average 94 % with average mining dilution of 17 % depending on the mining methodology. Mineral Resources are reported at an NSR cut-off grade of $75/t for veins classified as wide (Animas, Animas NE, Nancy, and San Cristobal) and $135/t for veins classified as narrow (all other veins) based on the same parameters used for Mineral Reserves, and a 15 % upside in metal prices
- Eric Chapman, P. Geo. (EGBC #36328) is the Qualified Person for resources and Raul Espinoza (FAUSIMM (CP) #309581) is the Qualified Person for reserves, both being employees of Fortuna Silver Mines Inc.
- Totals may not add due to rounding procedures
Maps and Sections
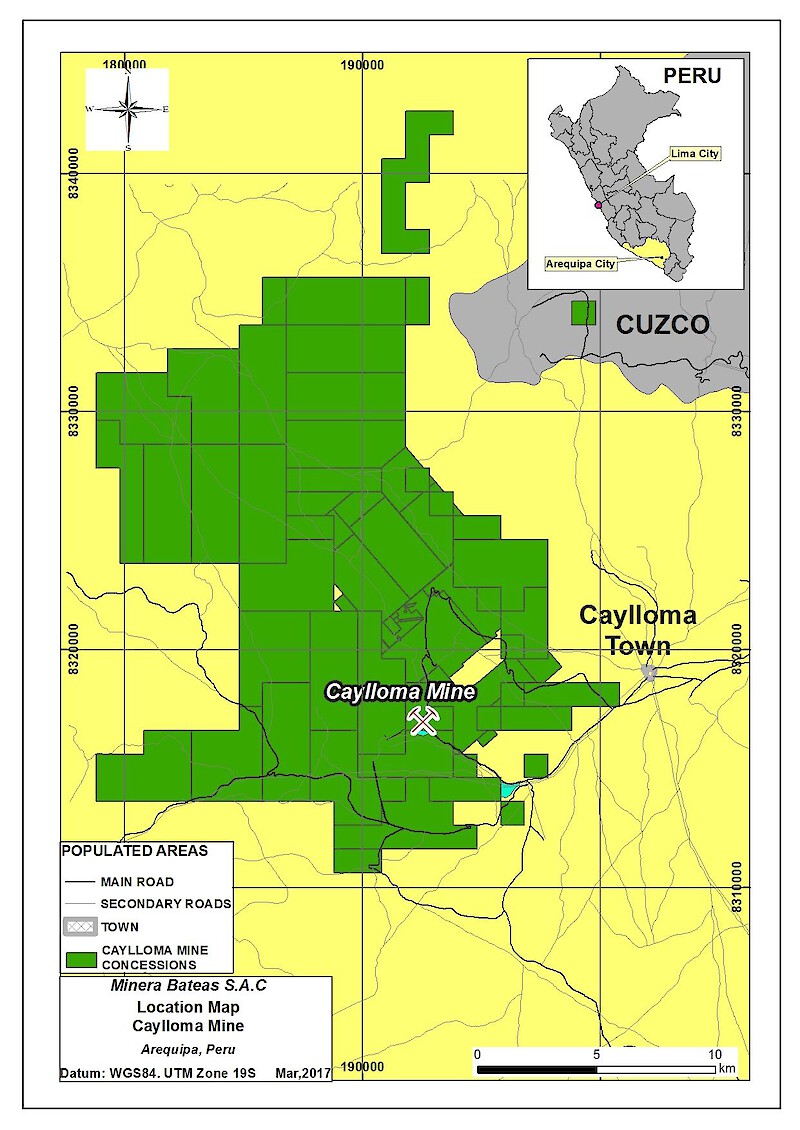
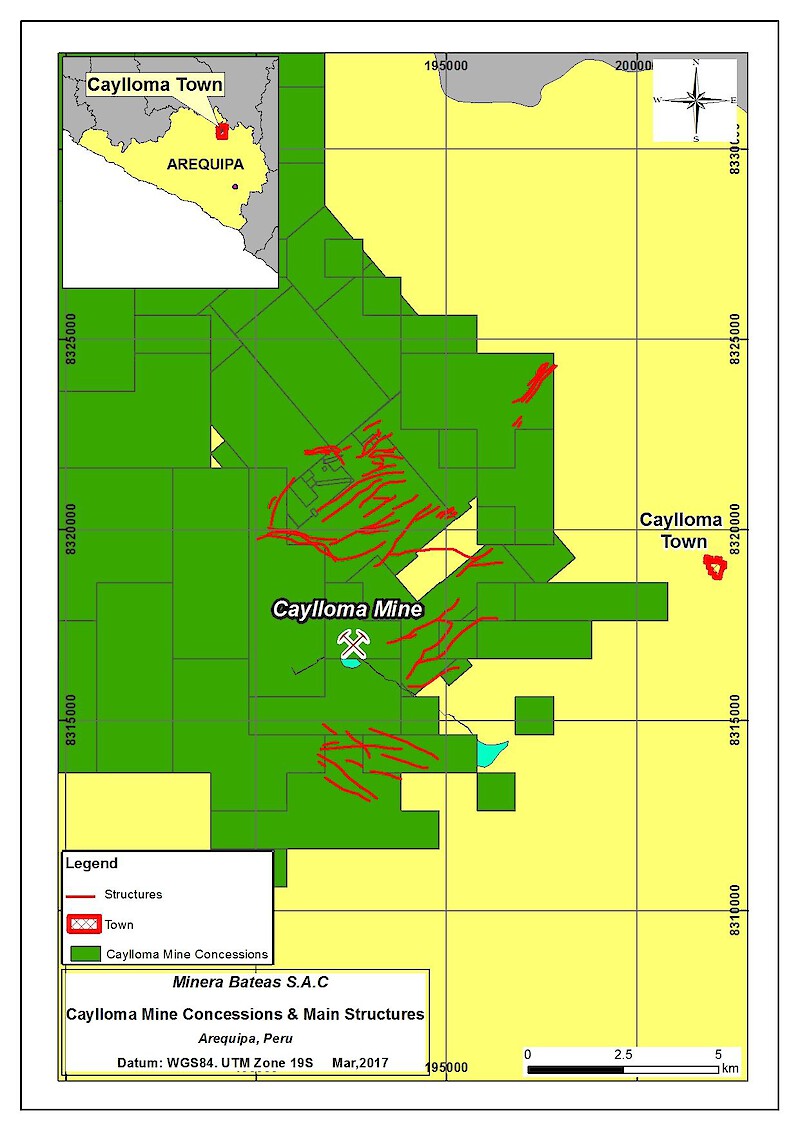
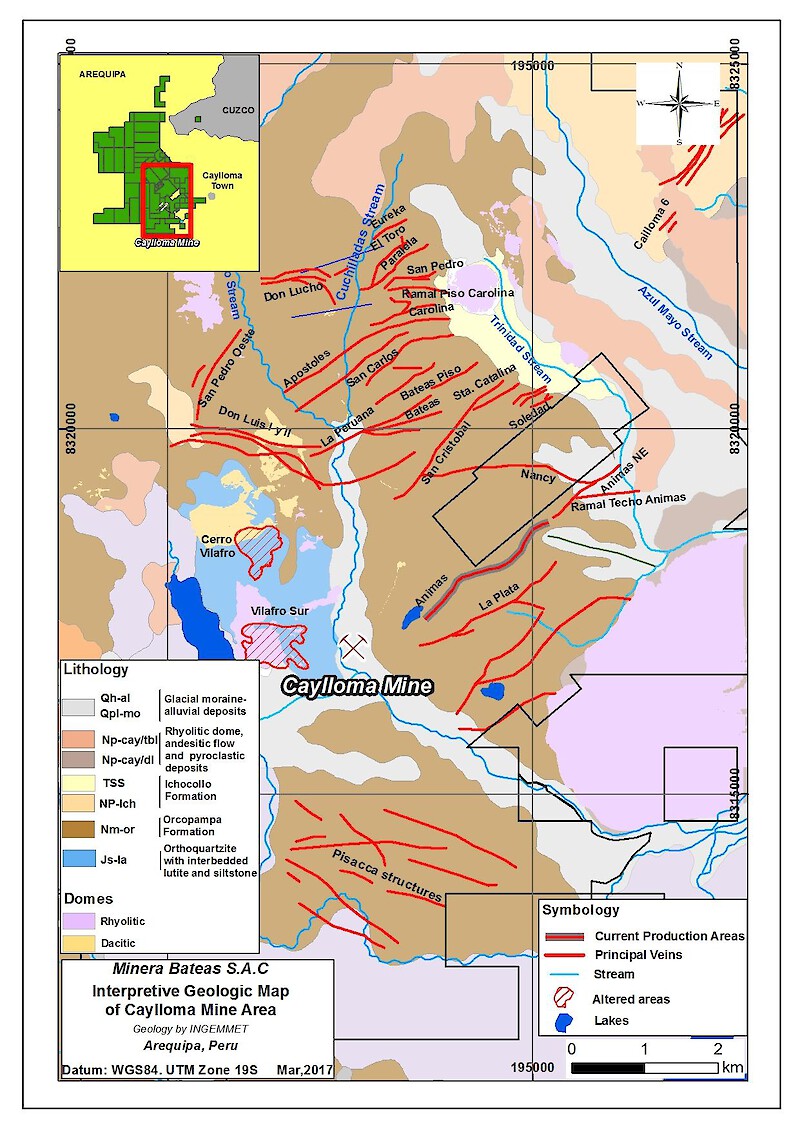
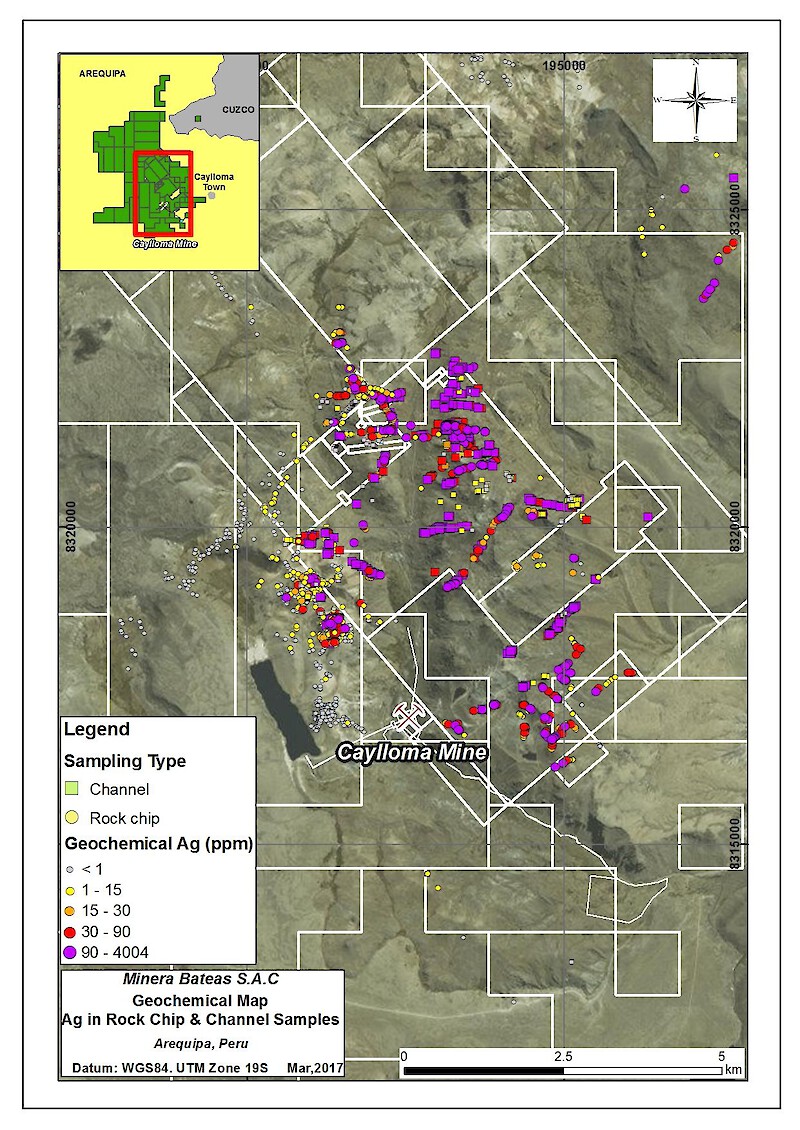
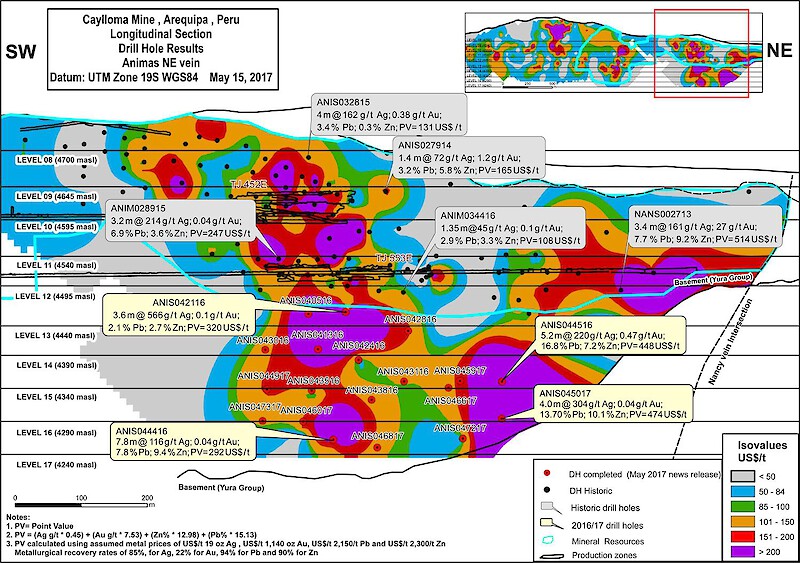
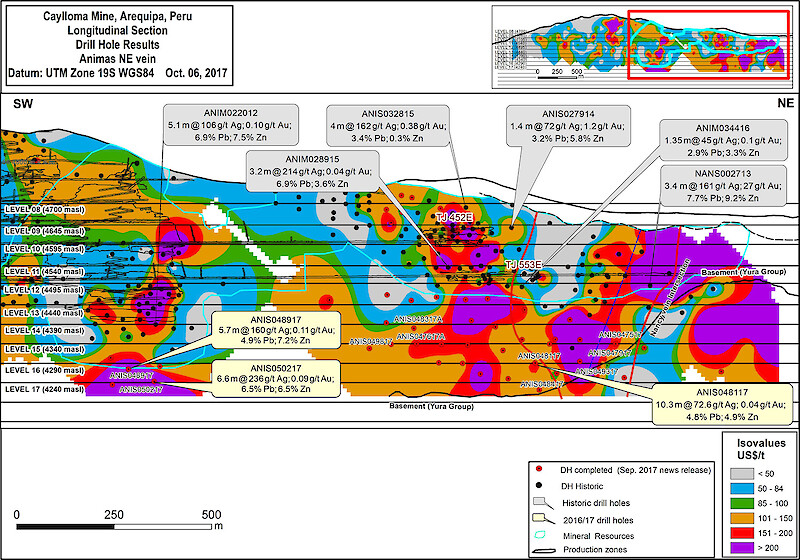
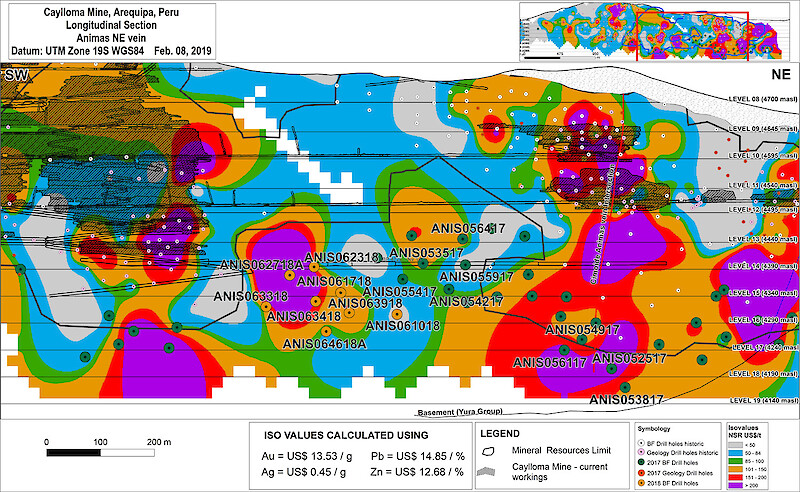
Photo Gallery
Corporate Video - A global intermediate gold and silver producer
Share


Stay Connected
Sign Up for Email Updates
Register to receive news via email from Fortuna Silver Mines Inc.
* Required Fields